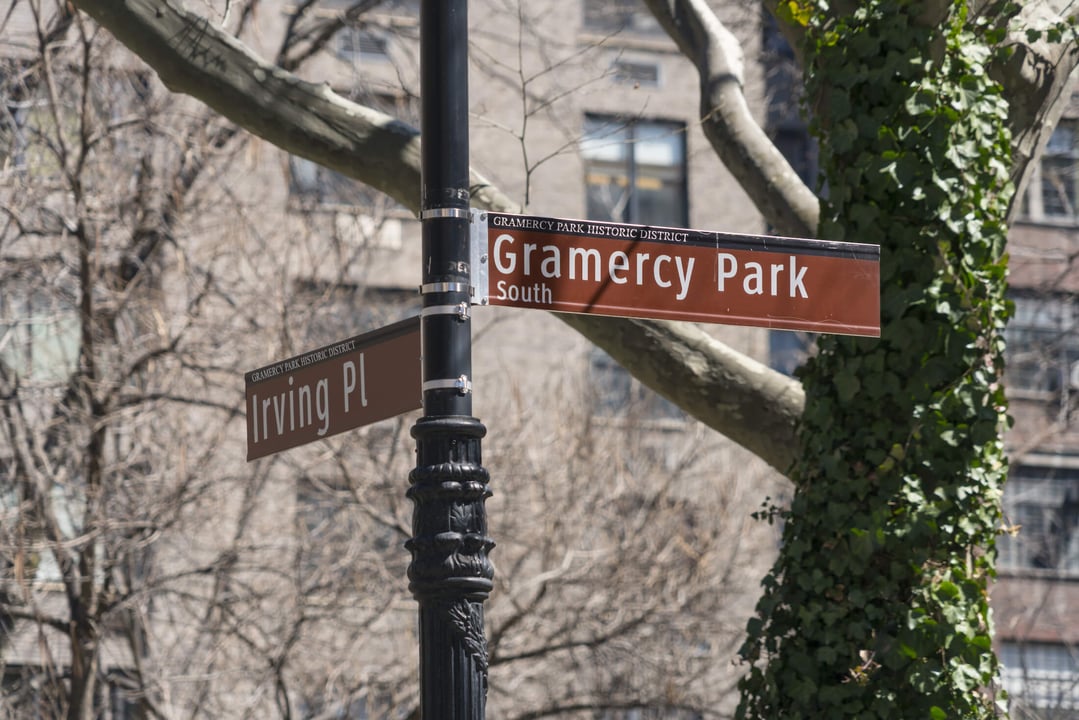
StreetEasy's October 2026 market report, published November 12, estimates that a buyer at the $900,000 citywide median sale price, with 20% down, pulls ahead of a renter after 14.5 years. A year ago its estimate was 12.4 years. Higher mortgage rates and higher prices added two years. On November 17, Curbed looked at the neighborhoods where that answer is very different, and in Manhattan one name stood out: Gramercy Park, where StreetEasy's model puts the break-even at 7.2 years, about half the citywide figure.
High rents explain the gap. Corcoran's October report shows Manhattan vacancy at 1.31%, the lowest reading since March 2020, and StreetEasy finds that renting loses its edge faster in neighborhoods where rents are high relative to sale prices. Anyone renting a family-size Manhattan apartment can run the same comparison on the specific home they would buy. Our Manhattan condo market analysis covers the wider sales picture.
At a glance
- StreetEasy's October model estimates that a New York City buyer paying the $900,000 median sale price, with 20% down at what it called current mortgage rates, pulls ahead of a renter after 14.5 years, up from 12.4 years in 2025.
- Gramercy Park is the only Manhattan neighborhood in StreetEasy's ten fastest break-even areas: a median sale price of $962,500, a median asking rent of $5,500 and a break-even of 7.2 years.
- StreetEasy puts Manhattan's median asking rent at $4,995 in October, up 8.6% from a year earlier. Corcoran puts the median rent at $5,279, up 6%, with vacancy at 1.31%.
- Freddie Mac's 30-year fixed rate averaged 7.11% on November 12, 2026, after a 52-week high of 7.4%.
- The break-even is a model, not a promise. It moves with the down payment, the rate, the carrying costs, the closing costs and how long you stay.
What the New Data Says
StreetEasy's break-even is the point at which a buyer's net financial position first exceeds a renter's. Its October report follows Zillow's method. The buyer has a 30-year fixed mortgage with 20% down and pays property taxes, insurance, maintenance and closing costs at both purchase and sale, while building equity and seeing the home's value grow at its local long-term trend. The renter pays rent and renter's insurance, with rent assumed to grow at the local long-term trend, and invests the money that would have gone to the down payment and closing costs at a conservative risk-free rate. Both paths are compared over 30 years in present-value terms.
Citywide, that comes to 14.5 years. StreetEasy attributes the two extra years to higher rates and higher sale prices. Its October data shows a tight market on both sides: New York City inventory fell 3.1% to 17,496 homes, the lowest October level since 2017, and 21.0% of homes sold above asking, up from 18.9%. In Manhattan, the median days on market fell to 43, down 25 days from a year earlier.
Nine of the ten fastest break-even areas are in Queens, Brooklyn and the Bronx. Lower purchase prices help in several of them, and StreetEasy credits strong asking-rent growth for Brooklyn Heights. Gramercy Park gets onto the list differently: it has the highest median sale price of the ten, and it still breaks even in 7.2 years because its rents are high. In its discussion of Brooklyn Heights, Curbed noted that the rent figure generally corresponds to a one-bedroom, possibly a two-bedroom, and that comparisons can shift for larger homes. The same caution applies to any neighborhood median.
Why High Rents Shorten the Clock
The simplest way to read the data is the price-to-rent ratio. StreetEasy divides each neighborhood's median sale price by twelve months of its median asking rent. Gramercy Park's ratio is 14.6, which means the median sale price equals about 14.6 years of median rent. For your own comparison, use a rental with similar size and finishes. With the other assumptions held equal, a lower ratio tends to mean an earlier break-even.
The same arithmetic works at any price. As an illustration only: if you pay $15,000 a month in rent, that is $180,000 a year. A comparable apartment priced at $2.7 million is a ratio of 15. The same apartment at $4.5 million is a ratio of 25. The first sits close to Gramercy Park's 14.6. The second is well above it, which points to a longer break-even if the other assumptions stay the same. You can model your own numbers in our rent vs buy calculator.
In Manhattan, StreetEasy's October median asking rent rose 8.6% from a year earlier while its median asking sale price fell 5.2% to $1,375,000. Corcoran reports that Manhattan's median rent was $5,279 in October, 2% below September's record and 6% above a year earlier, and that the average one-bedroom rent reached a new high of $5,587. Leases signed fell 12% from a year earlier to 3,586, the lowest October total Corcoran has reported in at least ten years. StreetEasy shows Manhattan rental inventory down 17.3% from a year earlier to 11,662 listings and expects the rental market to heat up this winter.
Where the Model Needs Your Numbers
A neighborhood median is a starting point. We would read Gramercy Park's 7.2 years as a signal about that neighborhood's rents, not as a forecast for any one apartment. For a Manhattan purchase, four inputs can move the result by years.
- Carrying costs. Condo common charges plus real estate taxes, or co-op maintenance, can differ widely between two apartments at the same price. Our guide to co-ops versus condos explains what each covers.
- Closing costs. The model charges costs at purchase and at sale. Ask your attorney which taxes and fees apply to your transaction, and see our breakdown of NYC closing costs.
- Financing. StreetEasy's October estimate assumes 20% down at the mortgage rates in its analysis. A larger down payment, or a cash purchase, changes the monthly comparison, and so does every move in the rate.
- How you will use the home. If the apartment would not be your primary residence, ask your tax adviser whether that use changes your costs, and whether New York's pied-a-terre surcharge has taken effect and would apply to the property. Our pied-a-terre tax post tracks its status.
This is general information, not tax, legal or financial advice. Speak with your attorney and financial adviser about your own situation.
How to Run the Math on a Specific Apartment
- Find the right rent comparison. Use asking rents for apartments in the same neighborhood with the same bedroom count and a similar building, not the borough median.
- Calculate the price-to-rent ratio. Divide the asking price by twelve months of that comparable rent. Gramercy Park's median works out to 14.6.
- Add the real monthly costs. Ask for the current common charges and taxes, or the maintenance, and any assessments the board has approved.
- Price in both ends of the deal. Include closing costs now and selling costs when you leave, then test a five-year, ten-year and fifteen-year stay.
- Test the rate. Run the numbers with your mortgage unchanged for the full term. If you want a refinance scenario, run it separately with refinancing costs included, and do not count on it.
Renting in Manhattan and weighing a purchase? We can compare a specific apartment against what you pay now, building by building. Message us on WhatsApp for a private, no-pressure conversation.
FAQ
Is it better to rent or buy in Manhattan in 2026?
It depends on the apartment and how long you will stay. StreetEasy's October 2026 model estimates a 14.5-year break-even citywide and 7.2 years in Gramercy Park, where high rents relative to sale prices shorten the modeled timeline. Run the numbers on the specific home you are considering.
What is the buy versus rent break-even point in New York City?
StreetEasy's October model estimates that a buyer paying the $900,000 citywide median, with 20% down, pulls ahead of a renter after 14.5 years. That is up from 12.4 years in 2025, which StreetEasy attributes to higher rates and prices.
Which Manhattan neighborhood breaks even fastest?
Gramercy Park is the only Manhattan neighborhood in StreetEasy's ten fastest break-even areas for October 2026, at 7.2 years. Its median sale price was $962,500 and its median asking rent was $5,500.
How high are Manhattan rents right now?
StreetEasy puts the October 2026 median asking rent at $4,995, up 8.6% from a year earlier. Corcoran reports a median rent of $5,279, up 6%, just below September's record, and a vacancy rate of 1.31%, the lowest since March 2020.
Which assumptions should I replace with my own numbers?
StreetEasy uses neighborhood medians, 20% down, a 30-year fixed loan and typical taxes, insurance, maintenance and closing costs. Your building's actual carrying costs, your down payment, your rate, how long you stay and whether the home is your primary residence can move the answer by years.
StreetEasy's citywide break-even is about two years longer than in 2025, and its Gramercy Park estimate is about half as long. Compare the actual apartment's costs with a comparable rental before you decide.
Related insights
- NYC Rent Freeze 2026: What Manhattan Buyers Should Know
- Manhattan Luxury Contracts: The Biggest Week of 2026
- NYC and Miami Mortgage Financing Guide
Sources: StreetEasy, "Inventory, not mortgage rates, weighing on NYC sales" (October 2026 market report, November 12, 2026); Curbed / New York Magazine, "The NYC Neighborhoods Where It's Smarter to Buy Than Rent" (November 17, 2026); Corcoran, NYC Residential Rental Market Report: October 2026 (November 13, 2026); Brick Underground (November 12, 2026); Freddie Mac Primary Mortgage Market Survey (November 12, 2026).